
Measure What Matters: The Origins and Evolution of Hospice Metrics
Families never ask for numbers. They ask: “Is it time?” Regulators demand proof. Auditors deny pay. Hospice teams lean on numbers to prove what the bedside already knows.
Centuries ago, decline was told in stories: “She stopped gathering food.” “He passed down his walking stick.” Today, it’s charted in scores: “PPS 40. FAST 7c. MAC 21 cm.” Tomorrow, an algorithm may flag the trend. The truth remains: dying is recognized when we are willing to face it. Metrics don’t replace that truth. They give us the language to defend it, teach it, and act before it’s too late.
In “The Shape of Dying” we named four trajectories: sudden death, terminal illness, organ failure, and frailty. But seeing a slope isn’t the same as measuring it. Anticipation isn’t enough—we need numbers to guide care.
That’s why hospice metrics matter. They transform instinct into evidence, stories into trends, and uncertainty into clarity. Let’s trace their origins of the numbers, and show why they’re essential now, and introduces the tools every hospice clinician must master.
From Noticing to Numbers: A History of Hospice Metrics
Metrics didn’t emerge in a vacuum; they grew from humanity’s long quest to make sense of decline. In 1662, John Graunt, a London haberdasher, pioneered this shift by analyzing parish Bills of Mortality. He adjusted for errors, flagged unusual causes of death (like “scalded in brewers mash”), and compared trends across years. Graunt became the first clinical data analyst—turning superstition into statistics and laying the groundwork for measuring decline.
Fast-forward to the 20th century. In 1948, Dr. David Karnofsky developed the Karnofsky Performance Scale (KPS) to standardize functional status in cancer patients undergoing chemotherapy. It wasn’t designed for hospice but introduced a numeric way to gauge decline—an influence still felt today.
The 1950s brought the Barthel Index, which scored activities of daily living (ADLs) like bathing, feeding, and ambulation in stroke patients. Again, not hospice-specific, but it marked a key evolution: observation became quantifiable scores.
By the 1980s, as hospice formalized, clinicians demanded tools tailored to end-of-life. The Palliative Performance Scale (PPS) built on KPS to assess broader decline. The Functional Assessment Staging Tool (FAST) mapped dementia’s slow trajectory. CMS later linked these to eligibility, making metrics not just academic but gateways to earlier care.
Years ago, I consulted on a patient whose family oscillated between aggressive treatments and exhaustion from organ failure crises. Her PPS was 40, and her ADLs all required help. Her medical team hesitated on hospice. By trending PPS downward and documenting recurrent hospitalizations, we painted a clear slope. That shifted the conversation—closing the revolving hospital door and opening peace at home. She whispered a week later, “I can rest.” Metrics didn’t just document. They bridged her decline and timely hospice care.
Why Metrics Matter Now: Waypoints on the Trajectory of Dying
Metrics serve four key purposes:
Shared language: Create consistency across the hospice team.
Clinical clarity: Reveal trends and urgency.
Regulatory documentation: Anchor CTIs, LCDs, and F2Fs, ensuring compliance without guesswork.
Family communication: Translate decline into specifics families can understand. Audits reveal a harsh truth. Denials rarely question decline itself but hinge on whether PPS, ADLs, or weight trends were documented consistently. One missing or inaccurate score can erase a clear picture of decline.
Understand Audit Reality: Denials rarely question decline itself. It only notes whether PPS or ADL scores were documented consistently. One missing or inaccurate score can erase months of decline.
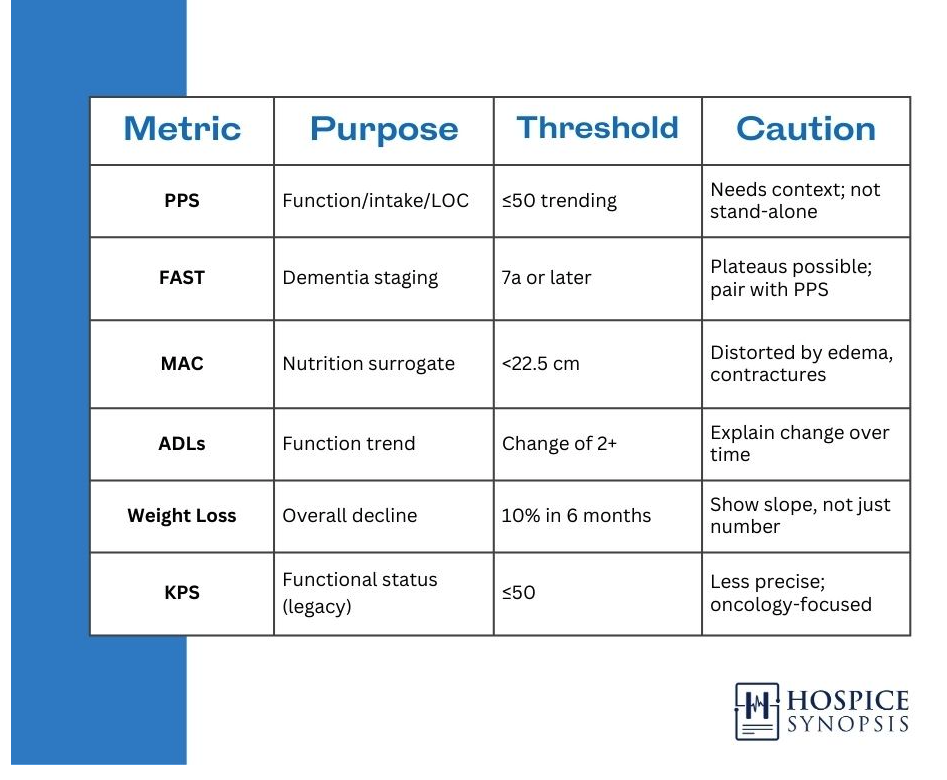
The Foundational Metrics
PPS (Palliative Performance Scale): Assesses ambulation, activity, intake, consciousness.
PPS 70: Fully ambulatory, reduced activity.
PPS 40: Mainly in bed, needs assistance.
PPS 10: Bedbound, minimal intake, drowsy.
Use with caution: PPS ≤50 is a commonly cited threshold, but eligibility is never a number alone. PPS must be supported by trend and documented changes.
FAST (Functional Assessment Staging Tool): Dementia staging, emphasizing frailty trajectories.
Stage 6: Needs help with dressing, bathing, toileting.
Stage 7: Loss of speech, ambulation, and ADLs.
Tip: Pair with PPS for corroboration.
MAC (Mid-Arm Circumference): Nutrition surrogate.
<22.5 cm often indicates cachexia.
Use consistently; watch for edema/contractures.
ADLs (Activities of Daily Living): Bathing, dressing, feeding, transferring, toileting.
Loss of 2+ signals progression before PPS shifts.
Weight Loss: ≥10% over 6 months is a red flag. Document the slope, not just the number. What matters is the trend, not a single weigh-in.
The IDG in Action
Consider a team discussing a frailty trajectory:
Aide: “Now needs two-person assist for transfers. Eating is slower. I write changes every shift. It shows decline in a way everyone can see”.
Chaplain: “She no longer speaks, but hums hymns when prayed with. I document that rhythm of connection and when it changes”.
Social Worker: “Rapid PPS drop—time to revisit advance directives.”
Nurse: “Oral intake <25%. PPS fell from 50 to 40 in one month.”
Each voice adds a data point. Together they map the shape of decline.
What Metrics Can’t Do
Always pair numbers to tell the story. Metrics matter when trended, not tallied. They guide, but they don’t decide.
They can’t predict exact timelines.
They can’t replace human presence.
They can mislead if interpreted in abstract.
Families sometimes ask, “What does FAST 7C mean?” To them, it’s not a stage. It’s their mother who no longer speaks, who once sang lullabies but now only hums. That’s where we must hold dignity while documenting decline.
Metrics and the Future
From Graunt’s 17th-century mortality tables to today’s AI-driven analytics, tools to measure decline keep evolving. Algorithms flag PPS trends, predict hospitalization risks, and highlight documentation gaps. Yet, they can’t hold a patient’s hand or interpret their silence. Metrics support but human judgment leads with clarity of care.
Conclusion
Metrics may feel overwhelming at first, but they’re your compass for navigating decline. Start with PPS and track it consistently, pair it with notes on what’s changed, and ask your team how it fits the patient’s trajectory. With practice, all of these tools become second nature, empowering you to deliver care that matters.
Summary
Hospice metrics transform decline from something we sense into something we can prove, teach, and act on. From Graunt’s 17th-century mortality tables to Karnofsky’s cancer scale and today’s PPS, FAST, ADLs, and MAC, each tool has turned bedside observation into language teams can share and regulators can recognize. Metrics give clarity. They align IDG voices, guide families, and protect the hospice benefit when documentation is challenged. But numbers are never enough on their own. They matter most when trended, explained, and paired with narrative. Used wisely, metrics defend care without replacing meaning.
Three insights
Metrics transform dying shapes into measurable trends, protecting care when used well and delaying it when mishandled.
PPS, FAST, MAC, ADLs, weight trends, and KPS form the backbone—essential for plotting any trajectory.
Consistency in measurement, contextual interpretation, and precise documentation is key.
Two actions
Always pair metrics with narrative: Don’t just score—explain the trend and tie to the shape.
In every IDG, ask: What changed? How does this fit the trajectory?
One call to action
Metrics are clinical respect in action. Master them to honor the dying process.
Glossary
Activities of Daily Living (ADLs) : Five core tasks: bathing, dressing, feeding, transferring, toileting. Changes often signal broad decline before PPS shifts. Document numeric changes consistently.
Audit Reality : The pattern where hospice denials or ALJ reviews turn not on whether decline occurred, but on whether documentation showed it. Missing or inconsistent PPS, ADL, or weight trends can erase months of obvious decline.
Functional Assessment Staging Tool (FAST) : Dementia staging system. Hospice eligibility begins at 7A (dependent for dressing); LCDs often cite 7C (non-ambulatory, limited speech). Pair with PPS or ADL decline for accuracy.
Karnofsky Performance Scale (KPS) : Legacy oncology scale, precursor to PPS. Still appears in some cancer notes.
Mid-Arm Circumference (MAC) : Nutrition surrogate when weight is unreliable. <22.5 cm often signals cachexia. Distorted by edema, obesity, or contractures—compare to priors.
Palliative Performance Scale (PPS) : 0–100% scale measuring ambulation, activity, intake, and consciousness. Core tool for eligibility and decline tracking. Scores ≤50 suggest major decline but never prove eligibility alone—trend and judgment decide.
Bibliography
• Glare, P. et al. (2008). A systematic review of physicians’ survival predictions in terminally ill cancer patients. BMJ, 327(7408), 195. https://doi.org/10.1136/bmj.327.7408.195
• Reisberg, B. (1988). Functional assessment staging (FAST) in Alzheimer’s disease. Psychopharmacology Bulletin, 24(4), 653–669.
• Anderson, F. et al. (1996). Palliative Performance Scale (PPS): a new tool. Journal of Palliative Care, 12(1), 5–11.
• White, N. et al. (2022). Prediction of death in palliative care: A systematic review. Palliative Medicine, 36(3), 470–484.
• Graunt, J. (1662). Natural and Political Observations Made upon the Bills of Mortality. London.
• Karnofsky, D. A., et al. (1948). The clinical evaluation of chemotherapeutic agents in cancer. Columbia University Symposium.
• NRG Oncology. (2020). Performance Status Measures: A Little History. https://www.nrgoncology.org/Home/News/Post/performance-status-measures—a-little-history
• Fast Fact #263: Palliative Performance Scale. https://www.mypcnow.org/fast-fact/palliative-performance-scale/